Established in 1965, Head Start promotes school readiness for children in low-income families by offering educational, nutritional, health, social, and other services. Early Head Start (EHS) launched in 1995 and, together with Head Start, has served more than 29 million children, birth to age 5, and pregnant women. In 2011, Head Start was funded to serve nearly one million children and pregnant women in center-based, home-based, and family child care programs in urban, suburban, and rural communities throughout the nation.
Throughout this Fact Sheet, unless otherwise specified, the term "Head Start" refers to the Head Start program as a whole, including: Head Start services to preschool children; EHS services to infants, toddlers, and pregnant women; services to families by American Indian and Alaska Native (AIAN) programs; and services to families by Migrant and Seasonal Head Start (MSHS) programs.
See PDF version: Head Start Program Facts: Fiscal Year 2011
The Head Start program is administered by the Office of Head Start (OHS), Administration for Children and Families (ACF), Department of Health and Human Services (HHS). Grants are awarded directly to local public agencies, private nonprofit and for-profit organizations, Indian Tribes, and school systems for the purpose of operating Head Start programs at the community level. The table below provides a snapshot of Head Start's funding allocations in Fiscal Year (FY) 2011.
| Fiscal Year | |
|---|---|
| Local Head Start Projects | Appropriation |
| States and Territories | $6,780,935,000 |
| American Indian and Alaska Native, and Migrant and Seasonal Programs |
$532,882,000 |
| Subtotal | $7,313,817,000 |
| Support Activities | |
| Training and Technical Assistance | $183,956,000 |
| Research, Demonstration and Evaluation | $19,951,000 |
| Monitoring/Program Review | $41,910,000 |
| Subtotal | $245,817,000 |
| TOTAL1 | $7,559,634,000 |
| Head Start, ARRA2 | 1,000,000,000 |
| Early Head Start, ARRA2 | 1,100,000,000 |
1The total above represents the funding available to the Head Start program after a rescission. The initial appropriation was $7,574,783,000.
2The American Recovery and Reinvestment Act (ARRA) appropriated $2.1 billion to the Head Start program in FY 2009 and was available for obligation for a two-year period. ARRA funds supported a variety of activities, including a cost-of-living adjustment, quality improvement, and an expansion of Head Start and EHS enrollment by 61,000 children, families, and pregnant women. Grantees used ARRA expansion funds awarded late in FY 2010 throughout FY 2011 to continue serving the children, families, and pregnant women added with ARRA funds.
The Head Start program serves children, families, and pregnant women in all 50 States, the District of Columbia, and six territories. The table in this section presents the total allocations and funded enrollment of Head Start programs aggregated by state and territory. American Indian and Alaska Native (AIAN) programs are funded to serve children in 26 states. Migrant and Seasonal Head Start allocations and funded enrollment are displayed as one total, as Migrant and Seasonal Head Start programs serve children birth to 5 and their families who move geographically with agricultural work. Thus, allocations and enrollment for these services cannot simply be attributed to individual states.
Note on Funded Enrollment: Head Start programs are required to contribute 20 percent of the total cost of their program from non-federal funds, unless a waiver is granted. Some programs meet this requirement by using State funds or other funding sources to directly support enrollment slots for children and pregnant women. These funds and enrollment slots are included in the table below. States may provide additional funding to local Head Start programs, either for quality improvements or to serve additional children, neither of which is reflected in this table.
| Program Allocations and Enrollment by State | ||||
|---|---|---|---|---|
| State/Territory | FY 2011 State/Territory FUNDING |
FY 2011 State/Territory ENROLLMENT | FY 2011 AIAN FUNDING1 |
FY2011 AIAN ENROLLMENT1 |
| Alabama | $118,538,454 | 17,301 | ||
| Alaska | $13,700,404 | 1,759 | $18,684,024 | 1,645 |
| Arizona | $114,920,032 | 14,137 | $44,821,917 | 5,904 |
| Arkansas | $71,284,596 | 10,789 | ||
| California | $913,314,091 | 105,834 | $7,653,225 | 700 |
| Colorado | $76,084,025 | 10,899 | $2,258,269 | 191 |
| Connecticut | $56,483,153 | 7,299 | ||
| Delaware | $14,582,960 | 2,209 | ||
| District of Columbia | $27,047,852 | 3,491 | ||
| Florida | $294,050,811 | 38,304 | ||
| Georgia | $187,289,495 | 25,040 | ||
| Hawaii | $24,750,678 | 3,187 | ||
| Idaho | $25,538,415 | 3,123 | $3,467,212 | 339 |
| Illinois | $298,559,425 | 41,703 | ||
| Indiana | $107,840,984 | 15,515 | ||
| Iowa | $56,555,143 | 8,137 | ||
| Kansas | $56,493,661 | 8,776 | $984,892 | 84 |
| Kentucky | $119,070,940 | 16,938 | ||
| Louisiana | $160,185,704 | 22,402 | ||
| Maine | $30,187,064 | 3,707 | $729,727 | 60 |
| Maryland | $85,450,156 | 10,885 | ||
| Massachusetts | $117,950,785 | 13,560 | ||
| Michigan | $256,329,651 | 35,758 | $6,742,753 | 610 |
| Minnesota | $79,494,477 | 11,371 | $9,272,691 | 941 |
| Mississippi | $174,610,322 | 27,396 | $2,167,154 | 276 |
| Missouri | $131,620,071 | 18,419 | ||
| Montana | $22,933,414 | 3,082 | $14,713,199 | 1,719 |
| Nebraska | $39,923,525 | 5,452 | $1,897,706 | 226 |
| Nevada | $27,655,675 | 3,100 | $3,437,057 | 362 |
| New Hampshire | $14,760,808 | 1,941 | ||
| New Jersey | $142,163,084 | 15,966 | ||
| New Mexico | $58,583,088 | 7,887 | $15,446,361 | 1,763 |
| New York | $473,230,126 | 51,496 | $1,263,255 | 143 |
| North Carolina | $159,627,572 | 20,901 | $2,722,553 | 246 |
| North Dakota | $18,998,575 | 2,498 | $9,746,893 | 1,000 |
| Ohio | $272,267,158 | 39,147 | ||
| Oklahoma | $91,151,052 | 14,506 | $22,929,225 | 2,882 |
| Oregon | $66,205,368 | 12,355 | $3,395,046 | 380 |
| Pennsylvania | $250,062,285 | 37,248 | ||
| Rhode Island | $24,019,635 | 2,966 | ||
| South Carolina | $92,680,645 | 13,121 | $909,993 | 80 |
| South Dakota | $20,634,052 | 2,987 | $15,635,267 | 1,710 |
| Tennessee | $130,885,676 | 17,323 | ||
| Texas | $529,791,786 | 72,776 | $424,701 | 34 |
| Utah | $42,274,915 | 6,117 | $1,822,129 | 215 |
| Vermont | $14,653,846 | 1,562 | ||
| Virginia | $109,393,196 | 14,460 | ||
| Washington | $111,137,972 | 12,369 | $12,194,324 | 1,415 |
| West Virginia | $55,548,315 | 8,234 | ||
| Wisconsin | $100,050,519 | 14,371 | $9,142,618 | 1,058 |
| Wyoming | $13,181,559 | 1,824 | $2,429,657 | 295 |
| Subtotal States: | $6,493,747,195 | 861,628 | ||
| Subtotal Indian Tribes: |
$214,891,848 | 24,278 | ||
| Migrant Programs | $317,889,153 | 35,966 | ||
| American Samoa | $2,256,017 | 1,532 | ||
| Guam | $2,369,904 | 534 | ||
| No. Marianas | $1,746,154 | 462 | ||
| Palau | $1,399,098 | 509 | ||
| Puerto Rico | $269,246,634 | 38,507 | ||
| Virgin Islands | $8,888,001 | 1,014 | ||
| TOTAL | $7,312,434,004 | 964,430 | ||
1AIAN funding is awarded to American Indian and Alaska Native tribes. For reference, the funding and enrollment has been split out by the state in which the tribe is headquartered. Some tribes serve children across state lines.
Note: The FY 2011 funding level does not include ARRA funds; however, Head Start grantees were still expending ARRA expansion funds awarded late in FY 2010 throughout FY 2011 to continue serving the children, families, and pregnant women added with ARRA funds. In the FY 2011 funding level, Congress included 50 percent of the funds necessary to continue operations for the expansion programs funded under ARRA, folding half of the expansion funding into the Head Start and EHS ongoing funding. In order to have sufficient funds to continue to serve all the children added with ARRA, Congress appropriated the remaining 50 percent in FY 2012.
About the Program Information Report (PIR)
Each year, Head Start programs submit cumulative data on the services they provided to children and families throughout the program year using the Program Information Report (PIR). The PIR also collects data on child and family demographics, staff, and program characteristics. The following section presents data from the 2011 PIR, which represents grantees' 2010-2011 program year. For a copy of the PIR form and additional information, please visit: https://eclkc.ohs.acf.hhs.gov/data-ongoing-monitoring/article/program-information-report-pir.
Program Characteristics
- Approximately 1,600 grantees operated programs during the 2010-2011 program year.
- 41 percent of grantees operated Head Start preschool services only.
- 13 percent of grantees operated EHS services only.
- 44 percent of grantees operated both Head Start and EHS services.
- In 2011, the PIR contained entries from about 2,900 programs. Head Start and EHS programs under the same grantee report separate PIRs. In addition, if a grantee has a formal contract with a delegate agency to provide some or all of the grantee's services, the delegate agency also reports a separate PIR.
Note on Fiscal Year Funded Enrollment Compared to Cumulative Enrollment: The program statistics in this section reflect data on the 1.1 million children and pregnant women who received Head Start services cumulatively throughout the 2011 program year. Due to turnover, more children and families receive Head Start services cumulatively throughout the program year (all of whom are reported in the PIR) than indicated by the fiscal year funded enrollment numbers in prior sections of this report. The fiscal year funded enrollment numbers in the prior sections reflect the number of children and pregnant women that Head Start programs were funded to serve at any one time during the program year; these are sometimes referred to as enrollment slots.
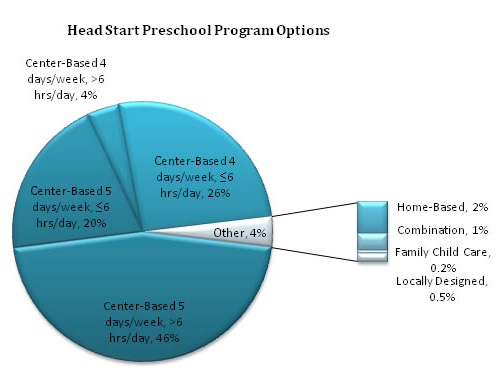
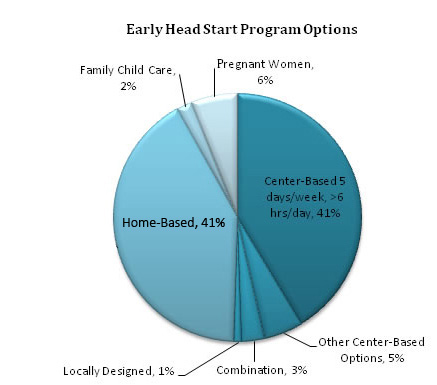
In Head Start preschool programs, the vast majority of services are offered in center-based settings, with variation in how many days per week and how many hours per day classes are in session. In Early Head Start programs, 41 percent of services are offered through the home-based program option.
Child and Family Demographics
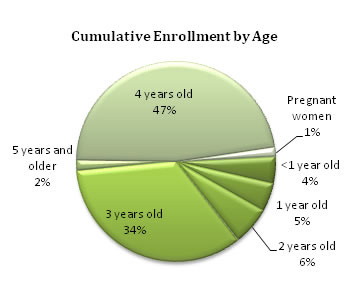
In 2011, Head Start programs throughout the country served 1,142,000 children ages birth to 5 and pregnant women cumulatively throughout the program year.
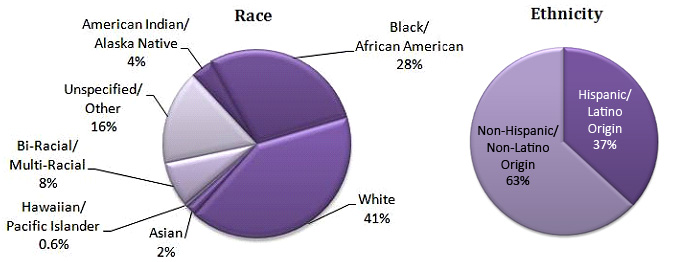
Head Start served a diverse group of children, families, and pregnant women. Nearly 40 percent identified themselves as Hispanic/Latino and almost 30 percent were Black/African American.
Note: Each enrollee is asked to self-identify both an ethnicity and a race category based on U.S. Census Bureau measures. For example, a family that identifies their child as Black and Cuban would be counted in the "Black or African American" race category for the race question and counted in the "Hispanic or Latino" category for the separate question on ethnicity.
Thirty percent of participants were from families that primarily spoke a language other than English at home. Twenty-six percent of participants were from families that primarily spoke Spanish at home.
Services to Children and Families
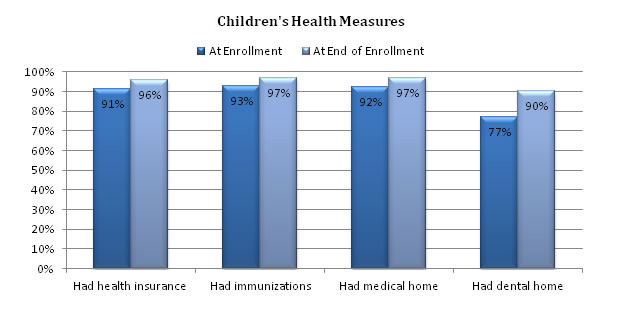
Head Start programs work with families to help ensure children have access to needed services and resources. In 2011, between the beginning and end of the program year, increases occurred in key areas of health insurance, immunizations, medical homes, and dental homes.
Head Start programs work with families to ensure they have the means to obtain health insurance, services for children with disabilities, adequate housing, job training, and more. In FY 2011:
- The majority of children had public health insurance. At the end of the program year, 87 percent of children were enrolled in either Medicaid/ Early and Periodic Screening, Diagnostic, and Treatment (EPSDT), CHIP, or a state funded child health insurance program.
- Twelve percent of all Head Start enrollment was comprised of children with disabilities, defined as children having specialized plans under the Individuals with Disabilities Education Act (IDEA). As a point of comparison, nationally, about three percent of infants and toddlers and six percent of preschool-age children have identified disabilities under IDEA. Head Start thus serves a greater percentage of children with disabilities than found in the overall population.
- Among pregnant women enrolled in EHS, 92 percent received prenatal education on fetal development and 19 percent had medically high risk pregnancies.
- Head Start served about 1,041,000 families cumulatively throughout the program year. The number of families served is slightly less than the number of participants served, since some families have more than one child enrolled.
- Nearly 44,000 families served during the enrollment year experienced homelessness. Of those families, 37 percent acquired housing during the program year.
- Almost 143,000 Head Start families received housing assistance such as subsidies, utilities, and repairs.
- About 295,000 families, or 28 percent, received services related to job training and adult education.
Program Staff
Head Start programs employed and contracted with a total of 248,000 staff in 2011. Parents of current or former Head Start children comprised 25 percent of Head Start staff.
- More than 1.3 million adults volunteered in their local Head Start program; of these, 873,000 were parents of Head Start children.
- About 125,000 staff members provided child development services directly to children; such staff included teachers, assistant teachers, home visitors, and family child care providers.
- Among child development staff, 31 percent were proficient in a language other than English.
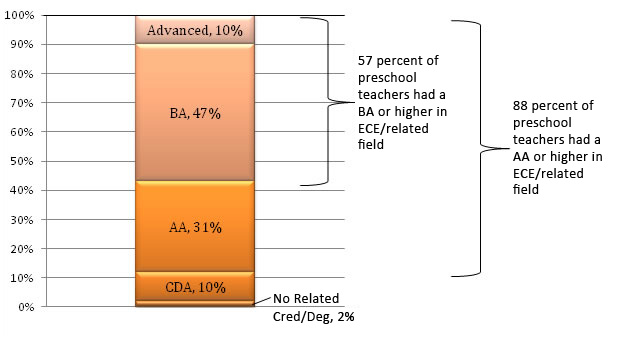
- In 2011, 57 percent of all Head Start center-based preschool teachers had a Baccalaureate degree or higher in early childhood education, or in a related field with experience. The Head Start Act specifies that 50 percent of center-based preschool teachers nationwide should have these credentials by 2013.
Center-Based Preschool Teachers' Degrees
« Go to Head Start Program Facts
Last Updated: September 30, 2022