
Established in 1965, Head Start promotes school readiness for children in low-income families by offering educational, nutritional, health, social, and other services. Since its inception, Head Start has served more than 37 million children, birth to age 5, and their families. In 2019, Head Start was funded to serve nearly 1 million children and pregnant women in centers, family homes, and in family child care homes in urban, suburban, and rural communities throughout the nation.
For term definitions and fact sheets from other years, see Head Start Program Annual Fact Sheets.
Federal Appropriations
The Congress of the United States authorizes the amount of federal spending for Head Start each year. The Head Start program is administered by the Administration for Children and Families (ACF) within the U.S. Department of Health and Human Services (HHS). Federal grants are awarded directly to public agencies, private nonprofit and for-profit organizations, tribal governments, and school systems for operating Head Start programs in local communities.
| Activity | Amount |
|---|---|
| Head Start Program, incl. Early Head Start-Child Care Partnerships | $9,658,096,317 |
| Training and Technical Assistance | $239,679,418 |
| Research, Demonstration, and Evaluation | $21,695,911 |
| Monitoring Support | $41,994,808 |
| Program Support | $41,994,256 |
| Designation Renewal System (DRS) Transitions Support | $24,999,980 |
| Total | $10,028,460,690 |
Annual Federal Funding and Funded Enrollment by State
The Head Start program serves children, families, and pregnant women in all 50 states, the District of Columbia, and six territories. The table in this section presents the total actual funding awarded and funded enrollment of Head Start programs in each state and territory.
AIAN funding is awarded to AIAN tribal governments. AIAN programs operate in 26 states, and in some cases, their services cross state lines. MSHS funding and funded enrollment are shown as one total, as this program supports children and families who receive services in various states during the year. Thus, federal funding and funded enrollment for these services cannot simply be attributed to individual states.
| Head Start (excl. AIAN) | AIAN1 | |||
|---|---|---|---|---|
| State/Territory | Federal Funding | Funded Enrollment | Federal Funding | Funded Enrollment |
| Alabama | $145,534,918 | 14,285 | ||
| Alaska | $18,635,001 | 1,474 | $34,121,364 | 1,924 |
| Arizona | $163,117,180 | 13,376 | $36,035,427 | 3,198 |
| Arkansas | $100,435,705 | 9,597 | ||
| California | $1,234,170,149 | 89,211 | $12,603,386 | 801 |
| Colorado | $110,068,356 | 9,631 | $2,564,882 | 183 |
| Connecticut | $68,784,202 | 5,755 | ||
| Delaware | $20,198,087 | 2,147 | ||
| District of Columbia | $36,274,655 | 3,727 | ||
| Florida | $409,664,176 | 40,632 | ||
| Georgia | $241,459,177 | 24,088 | ||
| Hawaii | $29,422,820 | 2,941 | ||
| Idaho | $37,515,332 | 2,944 | $4,575,915 | 319 |
| Illinois | $379,385,919 | 34,803 | ||
| Indiana | $147,022,115 | 13,973 | ||
| Iowa | $75,824,370 | 7,273 | ||
| Kansas | $75,832,939 | 7,060 | $1,998,314 | 109 |
| Kentucky | $169,948,523 | 15,167 | ||
| Louisiana | $194,760,231 | 20,819 | ||
| Maine | $41,009,877 | 3,027 | $845,254 | 60 |
| Maryland | $111,064,719 | 9,483 | ||
| Massachusetts | $150,718,056 | 11,771 | ||
| Michigan | $345,534,126 | 29,394 | $7,572,000 | 566 |
| Minnesota | $116,933,944 | 11,173 | $14,338,425 | 1,004 |
| Mississippi | $208,907,300 | 22,540 | $2,297,640 | 268 |
| Missouri | $174,843,143 | 14,663 | ||
| Montana | $34,836,453 | 3,051 | $19,277,877 | 1,790 |
| Nebraska | $56,351,047 | 4,912 | $5,299,519 | 349 |
| Nevada | $39,187,438 | 3,021 | $4,184,086 | 362 |
| New Hampshire | $19,754,206 | 1,563 | ||
| New Jersey | $177,684,738 | 15,464 | ||
| New Mexico | $71,647,498 | 7,055 | $27,772,014 | 2,452 |
| New York | $586,684,467 | 47,947 | $1,427,851 | 143 |
| North Carolina | $221,061,697 | 21,078 | $2,857,859 | 230 |
| North Dakota | $23,491,492 | 1,954 | $11,416,670 | 969 |
| Ohio | $357,759,541 | 34,004 | ||
| Oklahoma | $127,895,621 | 14,377 | $33,063,047 | 3,007 |
| Oregon | $99,168,561 | 12,724 | $4,314,780 | 396 |
| Pennsylvania | $333,717,500 | 35,979 | ||
| Rhode Island | $32,317,939 | 2,682 | ||
| South Carolina | $121,722,173 | 11,882 | $1,669,500 | 112 |
| South Dakota | $26,754,739 | 2,759 | $22,834,477 | 1,820 |
| Tennessee | $171,569,868 | 16,716 | ||
| Texas | $665,892,696 | 70,265 | $450,170 | 34 |
| Utah | $69,545,293 | 5,624 | $4,130,938 | 242 |
| Vermont | $22,364,137 | 1,447 | ||
| Virginia | $140,146,070 | 14,029 | ||
| Washington | $162,690,497 | 11,360 | $22,847,979 | 1,486 |
| West Virginia | $70,268,635 | 7,849 | ||
| Wisconsin | $142,200,733 | 13,372 | $13,121,798 | 1,089 |
| Wyoming | $19,819,142 | 1,590 | $2,896,335 | 295 |
| American Samoa | $3,951,215 | 1,332 | ||
| Guam | $3,474,939 | 534 | ||
| No. Marianas | $3,358,925 | 460 | ||
| Palau | $1,759,055 | 350 | ||
| Puerto Rico | $307,758,411 | 32,043 | ||
| Virgin Islands | $10,321,207 | 1,014 | ||
| Subtotal: | $8,932,220,953 | 819,391 | $294,517,507 | 23,208 |
| MSHS | $431,357,857 | 30,420 | ||
| Total | |
|---|---|
| Funding | $9,658,096,317 |
| Enrollment | 873,019 |
Program Year Statistics
Each year, Head Start programs are required to submit Program Information Reports (PIR) on the services they have provided to children and families throughout the program year, including child, family, and staff demographics and program characteristics.
For a copy of the PIR form, detailed reports, and data sets for the 2019 PIR and prior years, and for further information, please visit: Program Information Report (PIR)
Program Characteristics:
Most grantees provided both Head Start services. The methodology for calculating the percent of grantees by program type has been updated for this fact sheet, and moving forward, to reflect the agency level to account for multi-grant agencies.
- Twenty-nine percent of grantees provided Head Start preschool services only.
- Thirteen percent of grantees provided Early Head Start (EHS) services only.
- Fifty-eight percent of grantees provided both Head Start services.
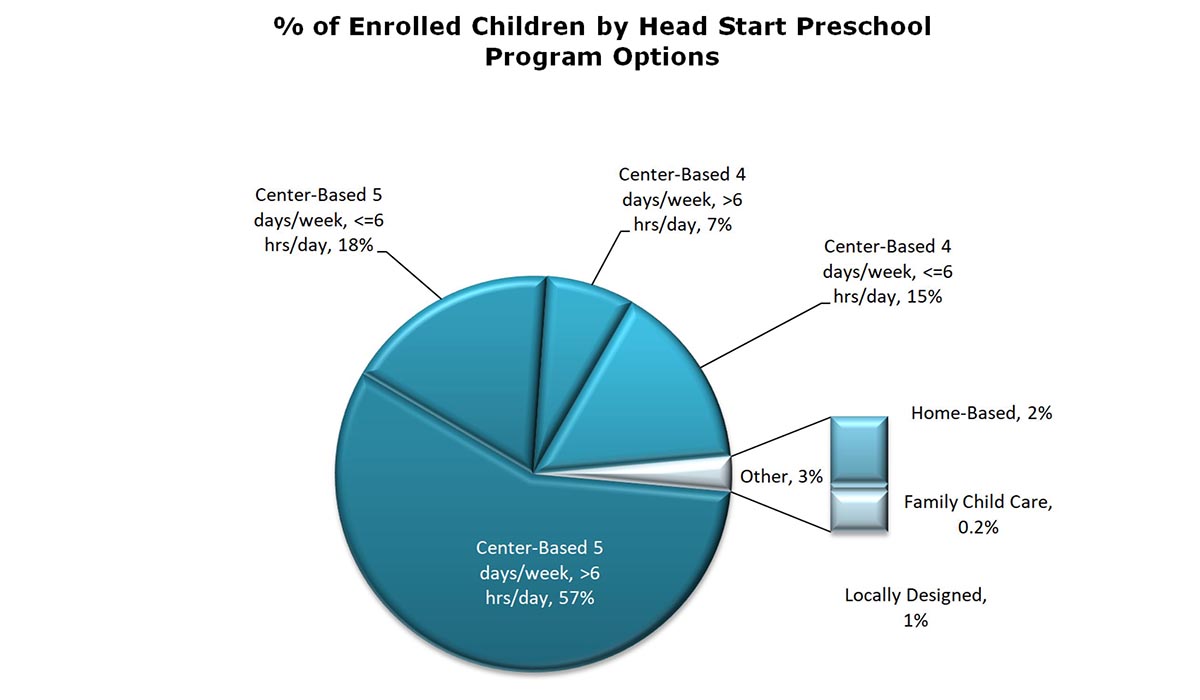
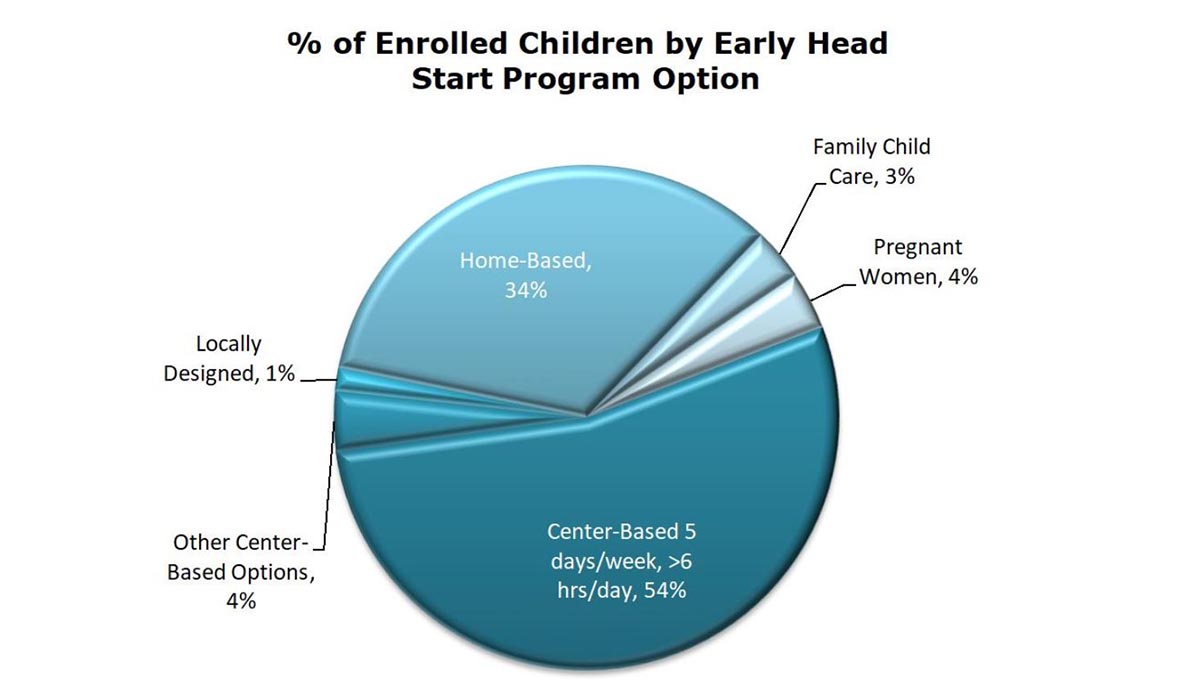
Most Head Start preschool services were provided in center-based settings that, based on local design, vary in the number of days per week and hours per day classes are in session. Over half of EHS services were provided in center-based settings, and less than half were offered in home-based program settings.
Child and Family Demographics:
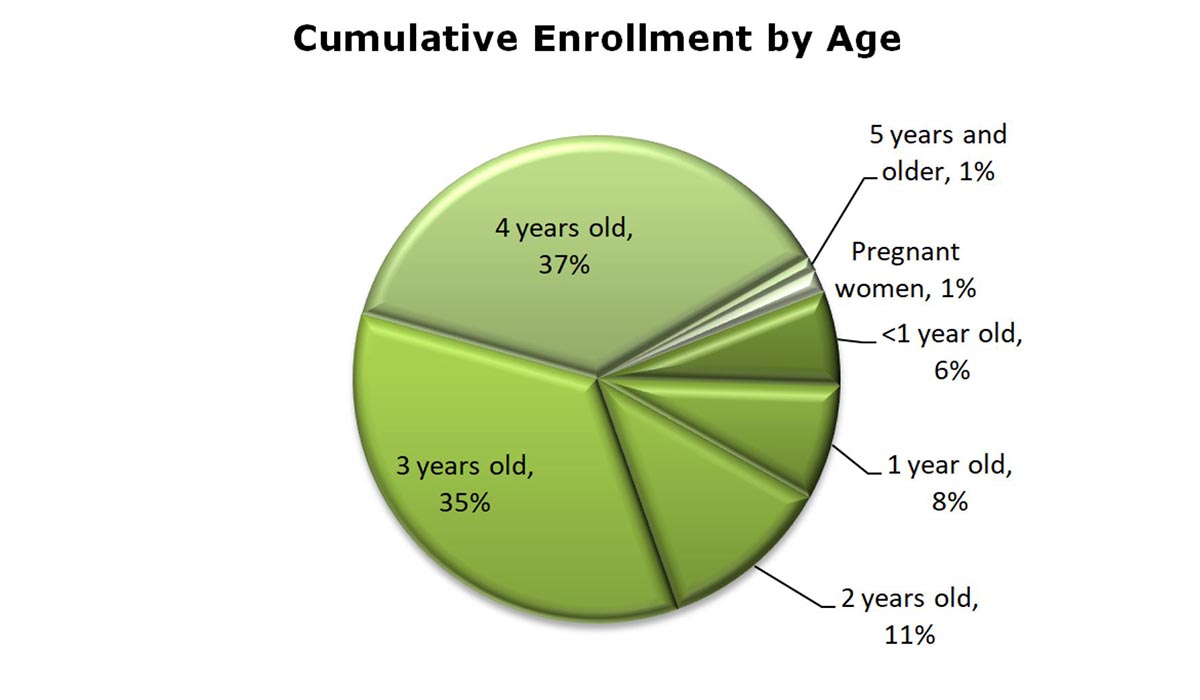
Head Start programs cumulatively served 1,047,000 children ages birth to 5 and pregnant women throughout the 2018–2019 program year.
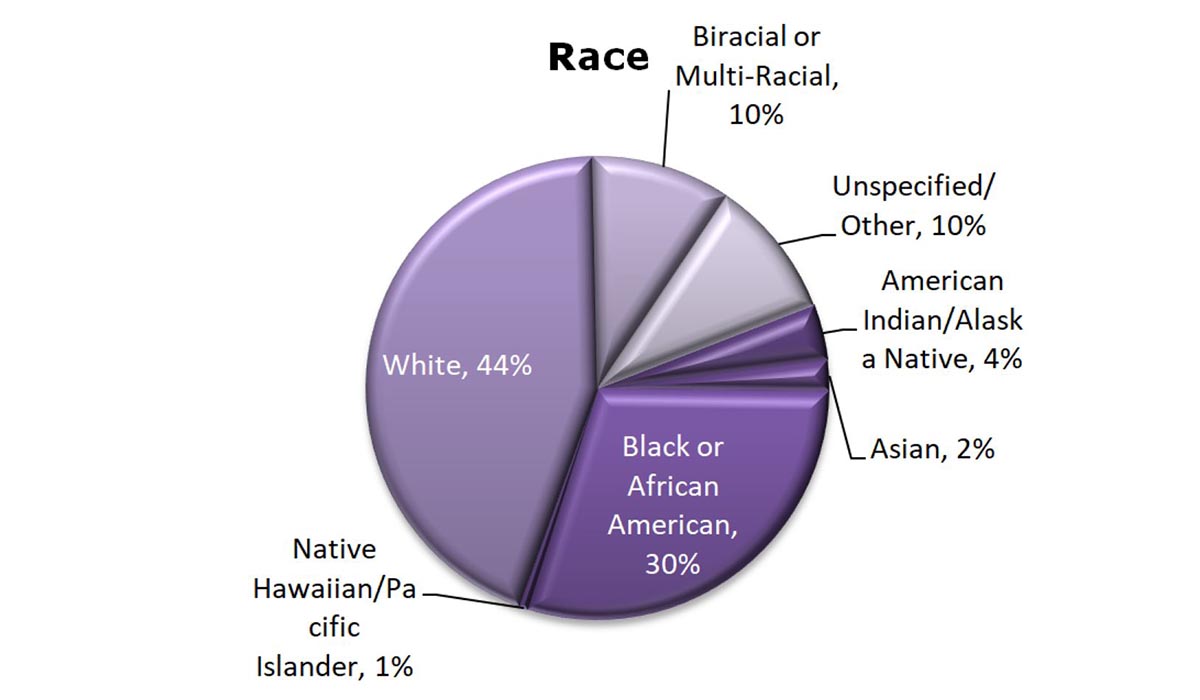
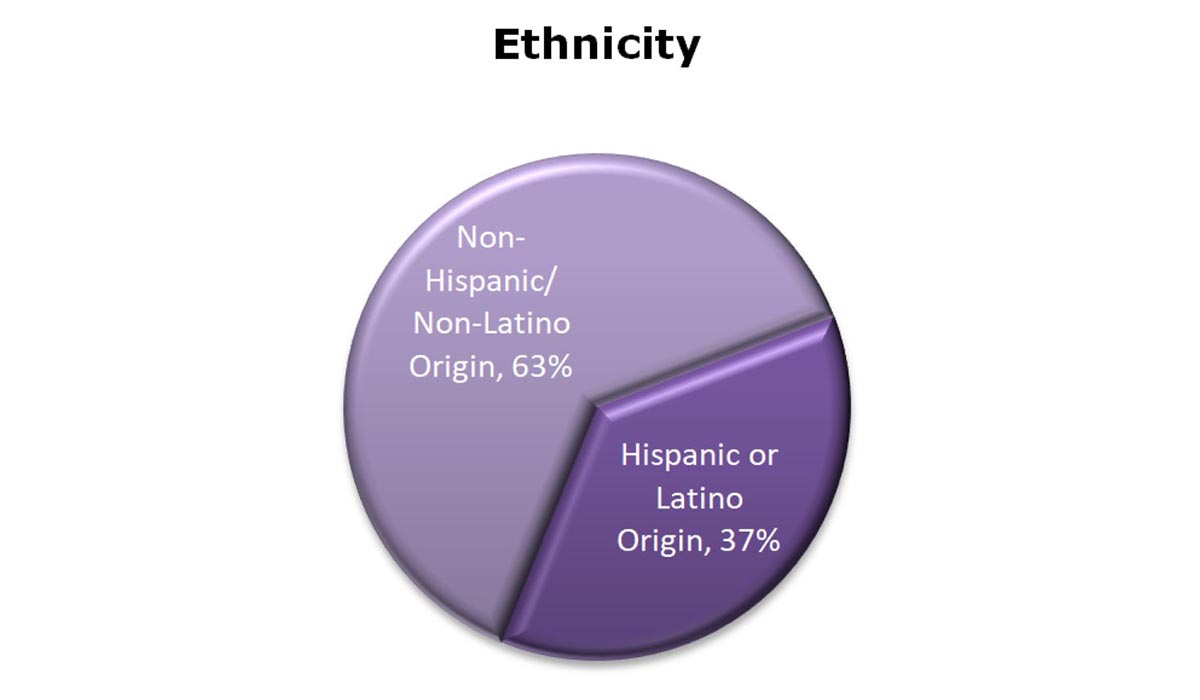
Head Start served a varied group of children, families, and pregnant women. Thirty-seven percent identified themselves as Hispanic/Latino, and 30% were Black/African-American.
Families were asked to self-identify both an ethnicity and a race category based on U.S. Census Bureau measures. For example, a family that identifies their child as Black and Cuban was counted in the "Black or African-American" race category for the race question and counted in the "Hispanic or Latino" category for the separate question on ethnicity.
Twenty-eight percent of participants were from families that primarily spoke a language other than English at home. Approximately 22% of participants were from families that primarily spoke Spanish at home.
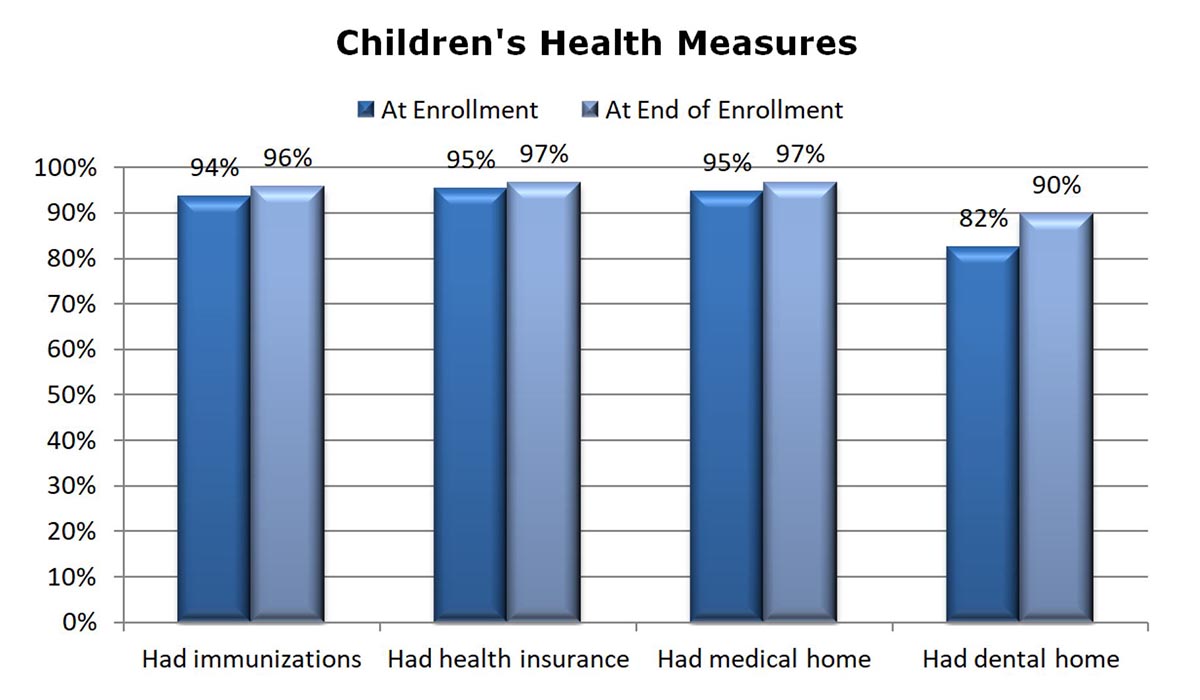
Services to Children and Families:
Head Start programs work with families to help ensure children have access to needed services and resources. The number of children who received immunizations increased from the beginning of the program year to the end of the program year. Also, more families had health insurance and medical and dental homes for their children at the end of the 2018–2019 program year than at the beginning.
Head Start programs work with families to ensure they have the means to obtain health insurance, services for children with disabilities, adequate housing, job training, and more. In fiscal year 2019:
- Most children had public health insurance. At the end of the program year, 90% of children were enrolled in Medicaid, the Children's Health Insurance Program (CHIP), or a state-funded child health insurance program.
- Thirteen percent of Head Start cumulative enrollment was made up of children with disabilities, defined as children having special plans under the Individuals with Disabilities Education Act (IDEA). In comparison, nationally, about 3% of infants and toddlers and 6% of preschool-age children have identified disabilities. Head Start serves a greater percentage of children with disabilities than found in the overall population.
- Among pregnant women enrolled in EHS, approximately 79% received prenatal education on fetal development and 21% had medically high-risk pregnancies.
- Head Start served about 947,000 families cumulatively throughout the program year. The number of families served is less than the number of participants served, since some families have more than one child enrolled.
- Approximately 59,000 families served during the enrollment year experienced homelessness. Of those families, 27% found housing during the program year. Approximately 69,000 Head Start families received housing assistance, such as subsidies, utilities, and repairs.
- Approximately 151,000 families, or 16%, received services related to job training and adult education, such as general equivalency diploma (GED) programs and college selection.
Program Staff:
Head Start programs employed and contracted with 273,000 staff. Parents of current or former Head Start children made up 23% of Head Start staff.
- Approximately 1,061,000 adults volunteered in their local Head Start program. Of these, 749,000 were parents of Head Start children.
- About 127,000 staff members provided child development services to children, including teachers, assistant teachers, home visitors, and family child care providers.
- Among child development staff, 30% were proficient in a language other than English.
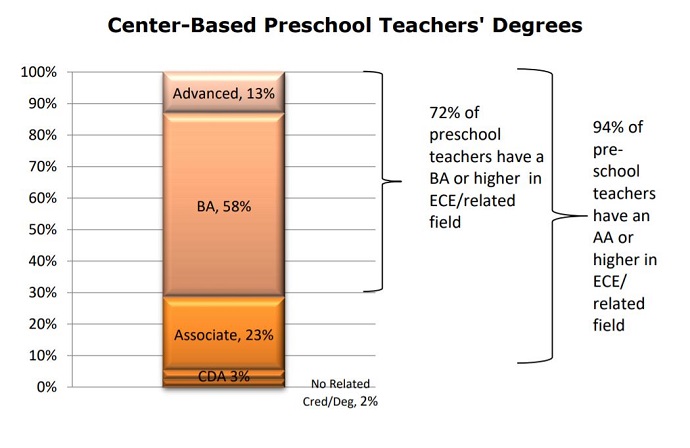
- Seventy-two percent of all Head Start center-based preschool teachers had a baccalaureate degree or higher in early childhood education, or in a related field with experience. The Head Start Act specifies that 50% of center-based preschool teachers nationwide should have had these credentials by 2013.
1AIAN funding is awarded to American Indian and Alaska Native Tribes. For reference, the funding and enrollment has been split out by the state in which the Tribe is headquartered. Some Tribes serve children across state lines.
« Go to Head Start Program Annual Fact Sheets
Last Updated: February 19, 2025